
The new How To Series blog post is now available. The article below is great for anyone looking for information on how to use JMeter and provides basic step-by-step information on how to get started.
JMeter is a very handy Java tool that can be used for all sorts of testing. Mostly used for load testing, it can do functional testing also and some other stuff that I haven’t digger into yet.
JMeter is awesome but I found that it was a bit tricky to get it set up to work the way you want it to. Specially where you’re trying to use its plugins. So I did some research found some awesome resources (that I would try to mention below) and got things to work.
This tutorial is here so that someone else if looking to use JMeter, could get to the awesomeness of it (load testing with informative and visual graphs in my case) without much hassle.
Let’s get started then:
Step 1: Download JMeter
Download from this link. Untar or unzip to your preferred directory.
I’m downloading version 3.1. Keep in mind that the older version have some setting differences. Anything earlier then version 2 definitely does.
With OSX, the easiest and preferred way for downloading JMeter would be through Homebrew.
brew install jmeter
With extra plugins:
brew install jmeter — with-plugins
The last time I checked this does not seem to give me the latest version though. I got 3.0. So I decided to used the untar way.
Step 2: Download JMeter plugin manager
Download from the link within the bracket. (plugins-manager.jar).
Copy this jar file in the lib/ext folder.
Start/Restart JMeter and you can will the plugin manager in Options/Plugin Manger in the top menu.
Step 3: Open JMeter
If you’ve installed JMeter through Homebrew it’ll be universally set up. Otherwise you’d have to navigate to the bin folder of your JMeter installation from Terminal or bash or command line and run JMeter from there.
You can go to the bin directory and double click bin/jmeter.sh to run it in Graphical User Interface (GUI) mode.
Note: Don’t run heavy test on GUI mode, I did it on Mac Book Pro and it crashed when I did a 50 odd thread test. Learnt it the hard way.
Step 4: Install Plugins
JMeter does have some graphs and matrices but its not super informative. Unless you absolutely know what you’re looking for, the JMeter readings out of the box will just fly over your head (did for me).
To get better visual and simpler graph interrelation of your data and readings you need some plugins.
You can do this in of the two ways, using Plugin Manger or manually:
Install the plugins through Plugin Manage:
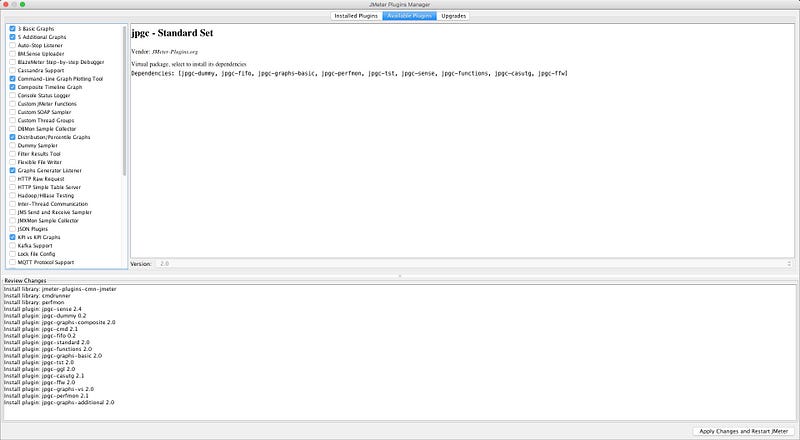
- Here are some plugins that we are going to need, selected.
- Just select the plugins you want to install and then click ‘Apply changes and restart jMeter’.
- You don’t really have to include all the plugins that I have included but most important ones are jpgc — Standard, Command-line Graph Plotting Tools. Other plugins allow you to visualise graphs in GUI mode.
Note: There is jpgc — Standard Set plugin at the bottom of the list that needs to be selected that I was unable to include in the screenshot.
Just select the plugins you want to install and then click ‘Apply changes and restart jMeter’
Note: Now this is where it gets a bit tricky. You can download these plugins and they are all required but later when I ran the command it failed. It required some other files relating to Visualisation classes. Basically it will create the test but break while creating graph png images. If that happens you can manually download the plugins I’ll mention below.
If there is an error while generating graphs after the previous step do this (after looking at jmeter.log file of course) –
The error in jmeter.log would look something like this:
2016/12/22 13:37:43 WARN — kg.apc.jmeter.JMeterPluginsUtils: JMeter env exists. No one should see this normally.
2016/12/22 13:37:43 WARN — jmeter.engine.StandardJMeterEngine: Error encountered during shutdown of kg.apc.jmeter.listener.GraphsGeneratorListener@491666ad java.lang.RuntimeException: java.lang.ClassNotFoundException: kg.apc.jmeter.vizualizers.SynthesisReportGui
 at kg.apc.jmeter.PluginsCMDWorker.getGUIObject(PluginsCMDWorker.java:237)
 at kg.apc.jmeter.PluginsCMDWorker.getGUIObject(PluginsCMDWorker.java:234)
 at kg.apc.jmeter.PluginsCMDWorker.setPluginType(PluginsCMDWorker.java:73)
 at kg.apc.jmeter.listener.GraphsGeneratorListener.testEnded(GraphsGeneratorListener.java:221)
 at kg.apc.jmeter.listener.GraphsGeneratorListener.testEnded(GraphsGeneratorListener.java:137)
 at org.apache.jmeter.engine.StandardJMeterEngine.notifyTestListenersOfEnd(StandardJMeterEngine.java:216)
 at org.apache.jmeter.engine.StandardJMeterEngine.run(StandardJMeterEngine.java:437)
 at java.lang.Thread.run(Thread.java:745)
Caused by: java.lang.ClassNotFoundException: kg.apc.jmeter.vizualizers.SynthesisReportGui
 at java.net.URLClassLoader.findClass(URLClassLoader.java:381)
 at java.lang.ClassLoader.loadClass(ClassLoader.java:424)
 at java.lang.ClassLoader.loadClass(ClassLoader.java:357)
 at java.lang.Class.forName0(Native Method)
 at java.lang.Class.forName(Class.java:264)
 at kg.apc.jmeter.PluginsCMDWorker.getGUIObject(PluginsCMDWorker.java:227)
 … 7 more
Fix for above error:
Download the jar files and install manually:
- Go to JMeter Plugins Page.
- Download the plugins mentioned below:
– Go to the old zipped format of plugin page. (here)
– You’re looking for this plugins (Look for the latest versions of these plugins):
– JMeterPlugins-Standard-1.4.0.zip (or newer version) - The main jar files you’re looking for is JMeterPlugins-Standard.jar which goes into
lib/extdirectory. - The hierarchy is shown in the zip file so that you know which jar file goes into
liband which go intolib/ext.
Step 5: User Settings for JMeter plugins
Open <jmeter home>/bin/user.properties .
Add these properties at the bottom of the file:
jmeter.save.saveservice.output_format=csv jmeter.save.saveservice.data_type=false jmeter.save.saveservice.label=true jmeter.save.saveservice.response_code=true jmeter.save.saveservice.response_data.on_error=false jmeter.save.saveservice.response_message=false jmeter.save.saveservice.assertion_results_failure_message=false jmeter.save.saveservice.successful=true jmeter.save.saveservice.thread_name=true jmeter.save.saveservice.time=true jmeter.save.saveservice.subresults=false jmeter.save.saveservice.assertions=true jmeter.save.saveservice.latency=true jmeter.save.saveservice.bytes=true jmeter.save.saveservice.hostname=true
# This will enable correct graphs display
# which deal with threads after reloading the results file. jmeter.save.saveservice.thread_counts=true
jmeter.save.saveservice.sample_count=true jmeter.save.saveservice.timestamp_format=HH:mm:ss jmeter.save.saveservice.default_delimiter=; jmeter.save.saveservice.print_field_names=true
# This is needed to ensure all results are
# available when Listener runs jmeter.save.saveservice.autoflush=true
Step 6: Setup the test and add Graph Generator listener
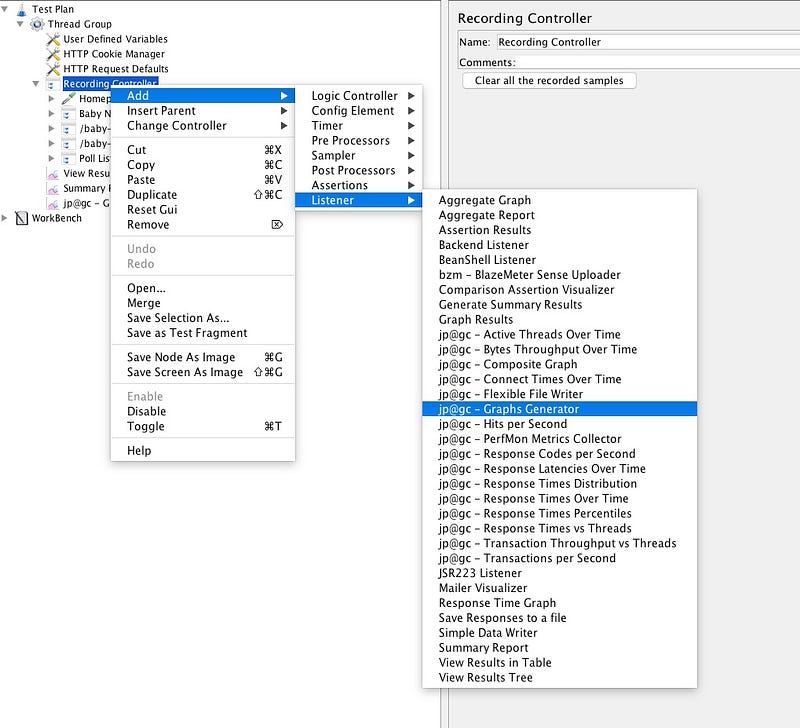
Create the test in the GUI view.
Then right click on any of the thread groups or thread and navigate to jp@gc — Graph Generator.
Setup the graph generator:
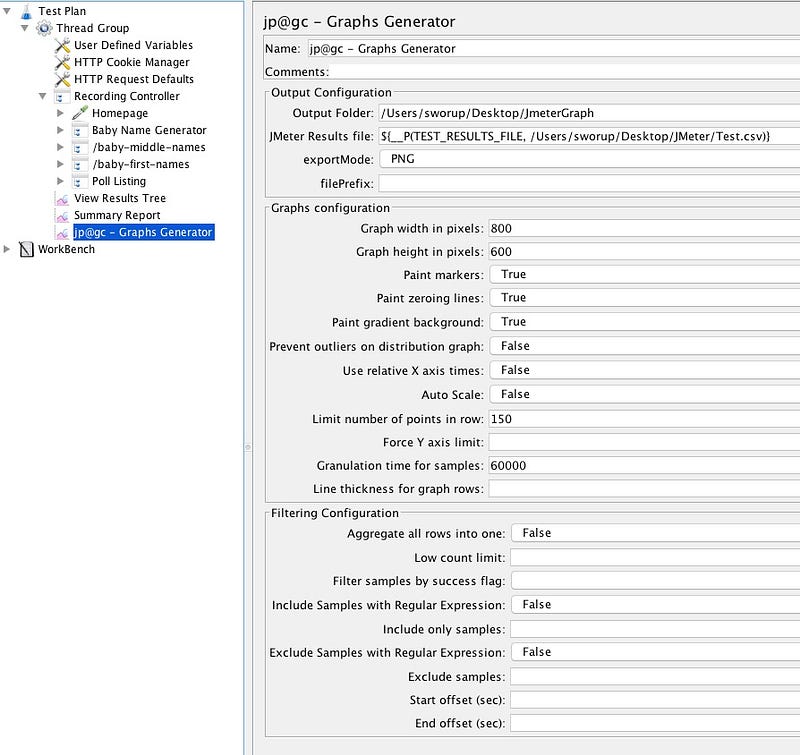
Here are few settings that I have changed:
Output Folder: Obviously its the folder where the output image graphs would be stored.
JMeter Result File: So this is the .csv file that JMeter test generates after running the test. This parameter is taken in as variable (that’s why $()) and it could be passed in through command as TEST_RESULTS_FILE . Also it’ll default to the path given as the second parameter of the __P function.
You can change the rest of the parameters or leave them as it is.
One interesting parameter is
Include only sampleswhere you can actually specify the samples you’d want to include in the graph. If its a large test this could help you narrow down and compare two or more tests or even look at a single sample.
Step 7: Run the test
Time to run the test.
In your terminal or command line or bash or whatever run this command to run the test and then generate the graphs:
~/Desktop/apache-jmeter-3.1>
bin/jmeter -t /Users/sworup/Desktop/JMeter/Test.jmx -n -l /Users/sworup/Desktop/JMeter/Test.csv -JTEST_RESULTS_FILE=/Users/sworup/Desktop/JMeter/Test.csv
Explanation:
bin/jmeter: We are running the jmeter executable which resides inside the bin directory since we’re running it from the <JMeter root>.
-t <path/to/test.jmx>: This is basically pointing the path to the test file.
-n: This means non GUI mode. It is very important if you’re running a heavy test.
-l <path/to/Test.csv>:This command sets the files to output the test result. This file can be used to see graphs in GUI version but here we would use this file to generate the graph in the directory we want later.
-JTEST_RESULTS_FILE=<path/to/Test.csv>: The -J switch is to set the variable we set in jp@gc Graphs Generator earlier, at JMeter results file. So the path we mention here would override the path set there and if we leave this blank, the default value in GUI should take over.
Finally:
That’s about it.
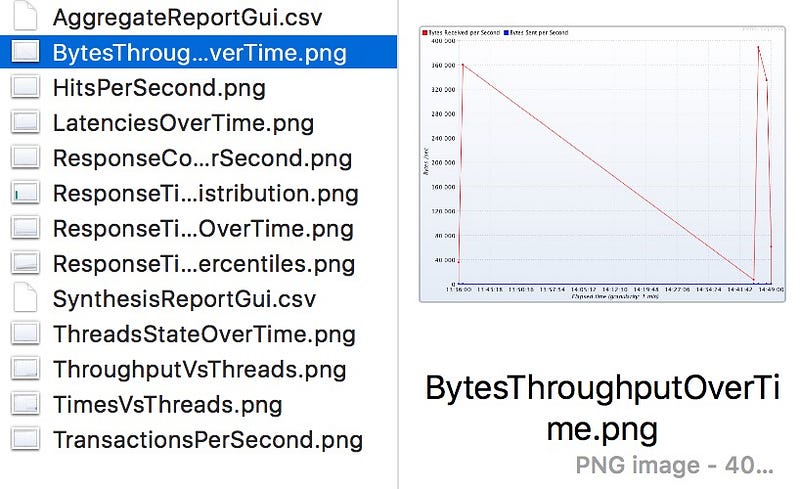
Now we can go to the folder we mentioned as Output Folder and walaah! the reports are there.
References:
Here are some of the resources that I found to be helpful. Most of the codes and instructions in this post came from this resources:
Don’t forget to to follow the rest of our How To Series on Huddle. Make sure to share the article with friends, sharing is caring!