
Does this look familiar to you?
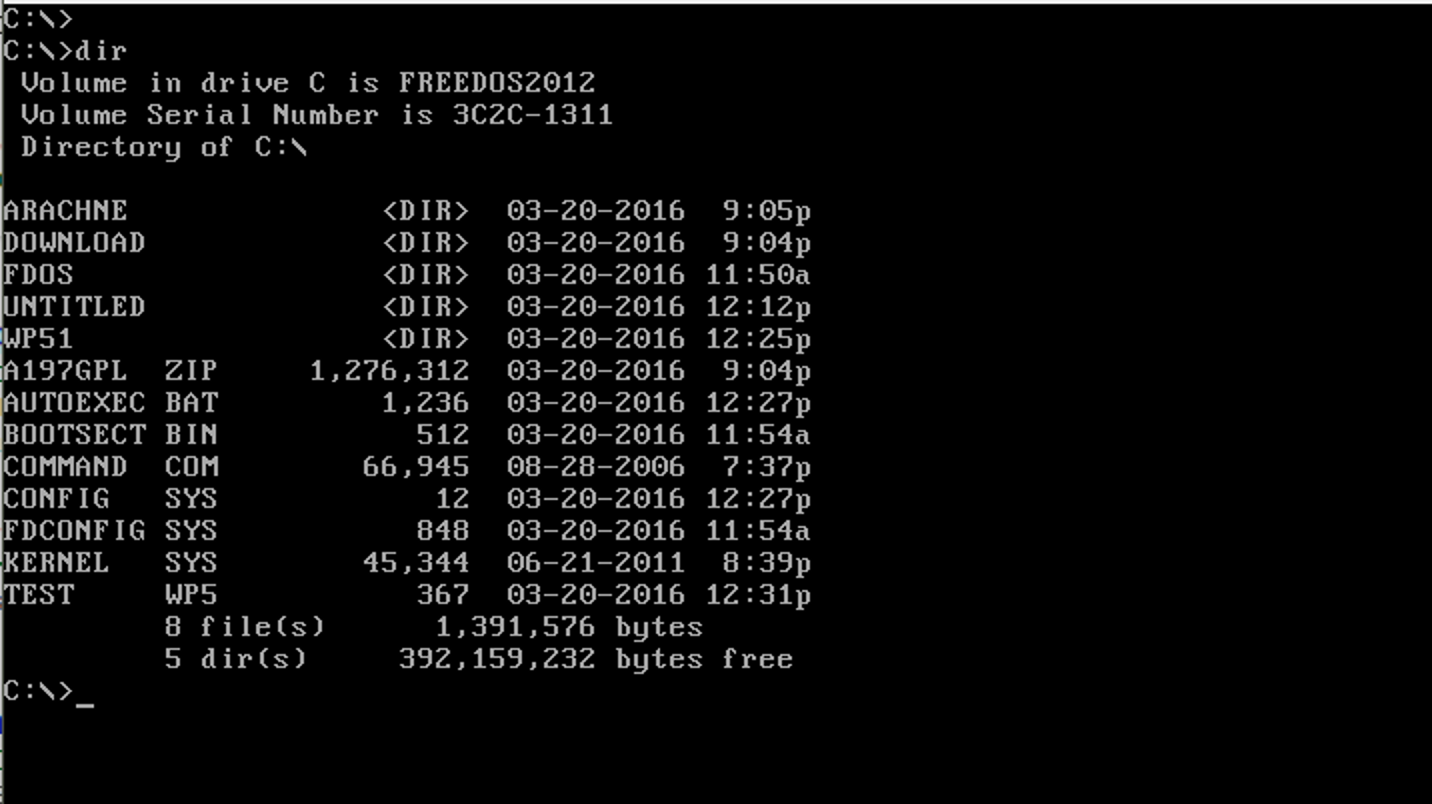
This screen may bring back memories, it may make you feel old or you may even think that this is ‘the command prompt’. To me it brings back memories (and makes me feel old). Good old DOS. Many years ago now we got a real computer. That was the first time I was introduced to DOS and the screen looked even worse than this screenshot. It was an XT on an amber monitor.
At the time I considered myself as someone that understood computers. I had wasted lot’s of time on my Commodore 64. This DOS thing though had me baffled. On that old XT I never really got the hang of it. It wasn’t until I bought a 486 that I learned how to use DOS. Yes young people, we used DOS in the 486 era. Windows 3.x was there, but not many were using that. So when your computer had booted such a screen as above was all you had to go on.
We had to learn how to use the computer. Being in University that meant learning from other students, reading tricks and tips in magazines (on paper) and even (gasp!) the manual. In those days computers were hard to use. Most people that started using them had someone else set it up and they learned just enough to start the word processor.
Speaking of word processors, this is what that looked like:
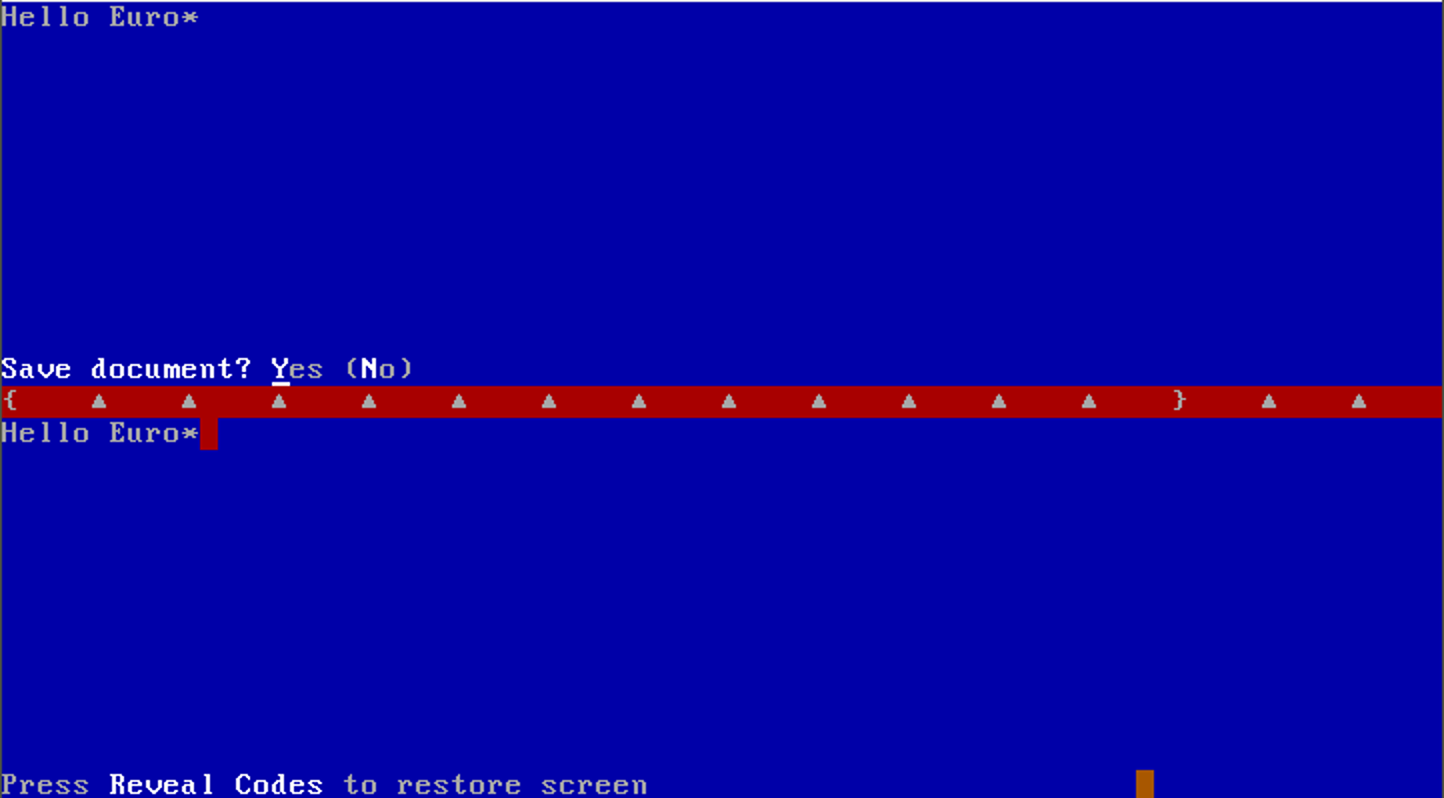
Using computers was considered difficult. People like me that got the hang of it were not called nerds or geeks but whiz kids. Most people learned just a few tricks to be somewhat productive. The screenshot above is of WordPerfect 5.1. People learned a few tricks to be able to use it. Things like how to open and save a document and how to print it. (Let us know in the comments below what key combinations you remember!)
WordPerfect had many other features which remained hidden for the vast majority of its users. I would almost say that people never used what they paid for, but then again, in reality hardly anyone really paid for it anyway.
Log Management
All of that changed since Windows 95. With this people that previously used their computers for not much more than a word processor and the odd game were starting to use the computer and the programs they ran to a much greater extend. This was obviously helped by the emergence of the Internet. Although I think it is fair to say the two helped the adoption of each other.
Windows made it much easier to learn how to use your computer without needing courses, training or help. It needed a bit getting used to, but once you did things became obvious.
The big difference between the days of DOS was that on the screen you got feedback on what was there, what the options were and what you had to set or select to get something done. With DOS and the DOS programs it wasn’t. Take the simple dir command in DOS to show you the contents of a folder (or in DOS terms, directory). Simply typing dir gave you the listing in a particular format that wasn’t too handy with many files and subdirectories in the directory. Adding the flag /w made the overview easier, albeit with less detail:
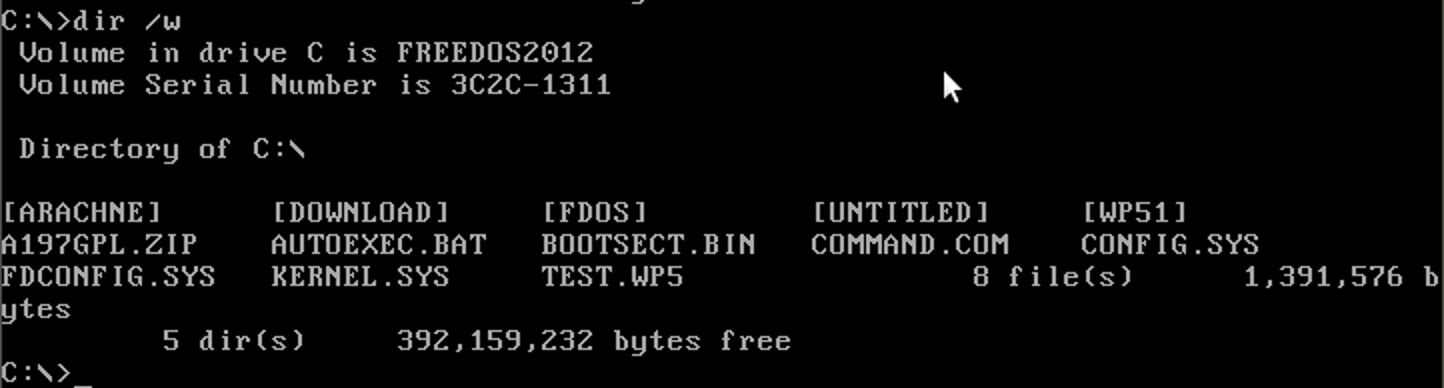
The thing is, you had to learn to use the flags. And each program or command had its own flag options. There usually was some feedback with a help file, but not like Windows programs where the options are shown clearly.
Obviously Windows has a learning curve too, but it is one that most people handled easily.
Windows, with its graphical user interface:
- Provides direct feedback on what options and functionality exist
- Shows you what you can and may need to set to get it working
As a result, being capable of using a computer became something that just about anyone nowadays can do. It is no longer in the realm of the Whiz Kids, or nerds.. Obviously not everyone is a real administrator, but we don’t need training anymore just to effectively use a computer.
So why the trip down memory lane? Lately I have been speaking on several conferences (including Eurostar) on using operational intelligence software for testing. One of the things I mentioned is how testers very much enjoyed using such software. Often I mentioned this as bit of a side note, but it is actually one of the largest benefits of using operational intelligence software in testing. And it occurred to me that there is a strong similarity between how the visualisation of the process through all the systems enabled the tester to learn about them in a similar way.
Operational Intelligence
Let’s step back a bit and explain what operation intelligence software does. Our IT systems have grown enormously in the last few decades. All the systems are also connected. Not only do they live on the same network, but the systems communicate with the other systems. Many business processes travel through a large number of systems. As a result, when something goes wrong, it can get hard to find out what and where something went wrong. In fact, it may even be hard to detect that something went wrong. Take for instance a web shop. A customer buys something with a credit card. The sale seems to go well, except that something went wrong in the billing system. The product is shipped since the logistics did get the message. But the customer doesn’t get billed. Customer happy, company not so much.
All those systems log events. They log successful events, errors, warnings etc. Engineers solving and preventing problems in the systems rely heavily on those logs. Each system however has its own method of logging. Usually everything is logged into multiple files. An ordinary web server will have access logs, error logs and usually a custom application log. And then there are also events that are logged into the standard logging of the operating system.
That means that the engineer needs to know where to find those logs. The logs contain a lot of data. They key is to find the right data. For that they have to open the log files, search through them. If you’re experienced and learned how to use tools such as grep, awk, sed etc. you can make this a bit easier but still it involves going through the files, opening multiple terminal sessions and still it is hard if not impossible to see the big picture.
There is however another way that smart engineers and companies are using. They employ operational intelligence systems. What these systems do is to make sure that every event that is written to log files is indexed in ‘real time’ as they are written to a central system. A key property of these systems is that they can handle any data. It does not have to be structured, it just needs to to exist and have a time stamp. And actually it doesn’t even need a time stamp. If no time stamp exist the system will add the the time it receives the event. The systems can also handle other data such as information written to database tables, but let’s not complicate this blog too much.
With all those lines written to log files being indexed in real time, we now have a central system with all the information in central place. What differentiates this from central logging systems is that the systems turn this into intelligence. The first and foremost feature is that you can now search through all this information just like you search through the internet using a search engine such as Google. You can search for keywords such as error, fatal, ORA-, time-out etc. And the system will show you all the events (log lines) with these keywords. Unlike Google however, it will show these chronologically with a timeline:
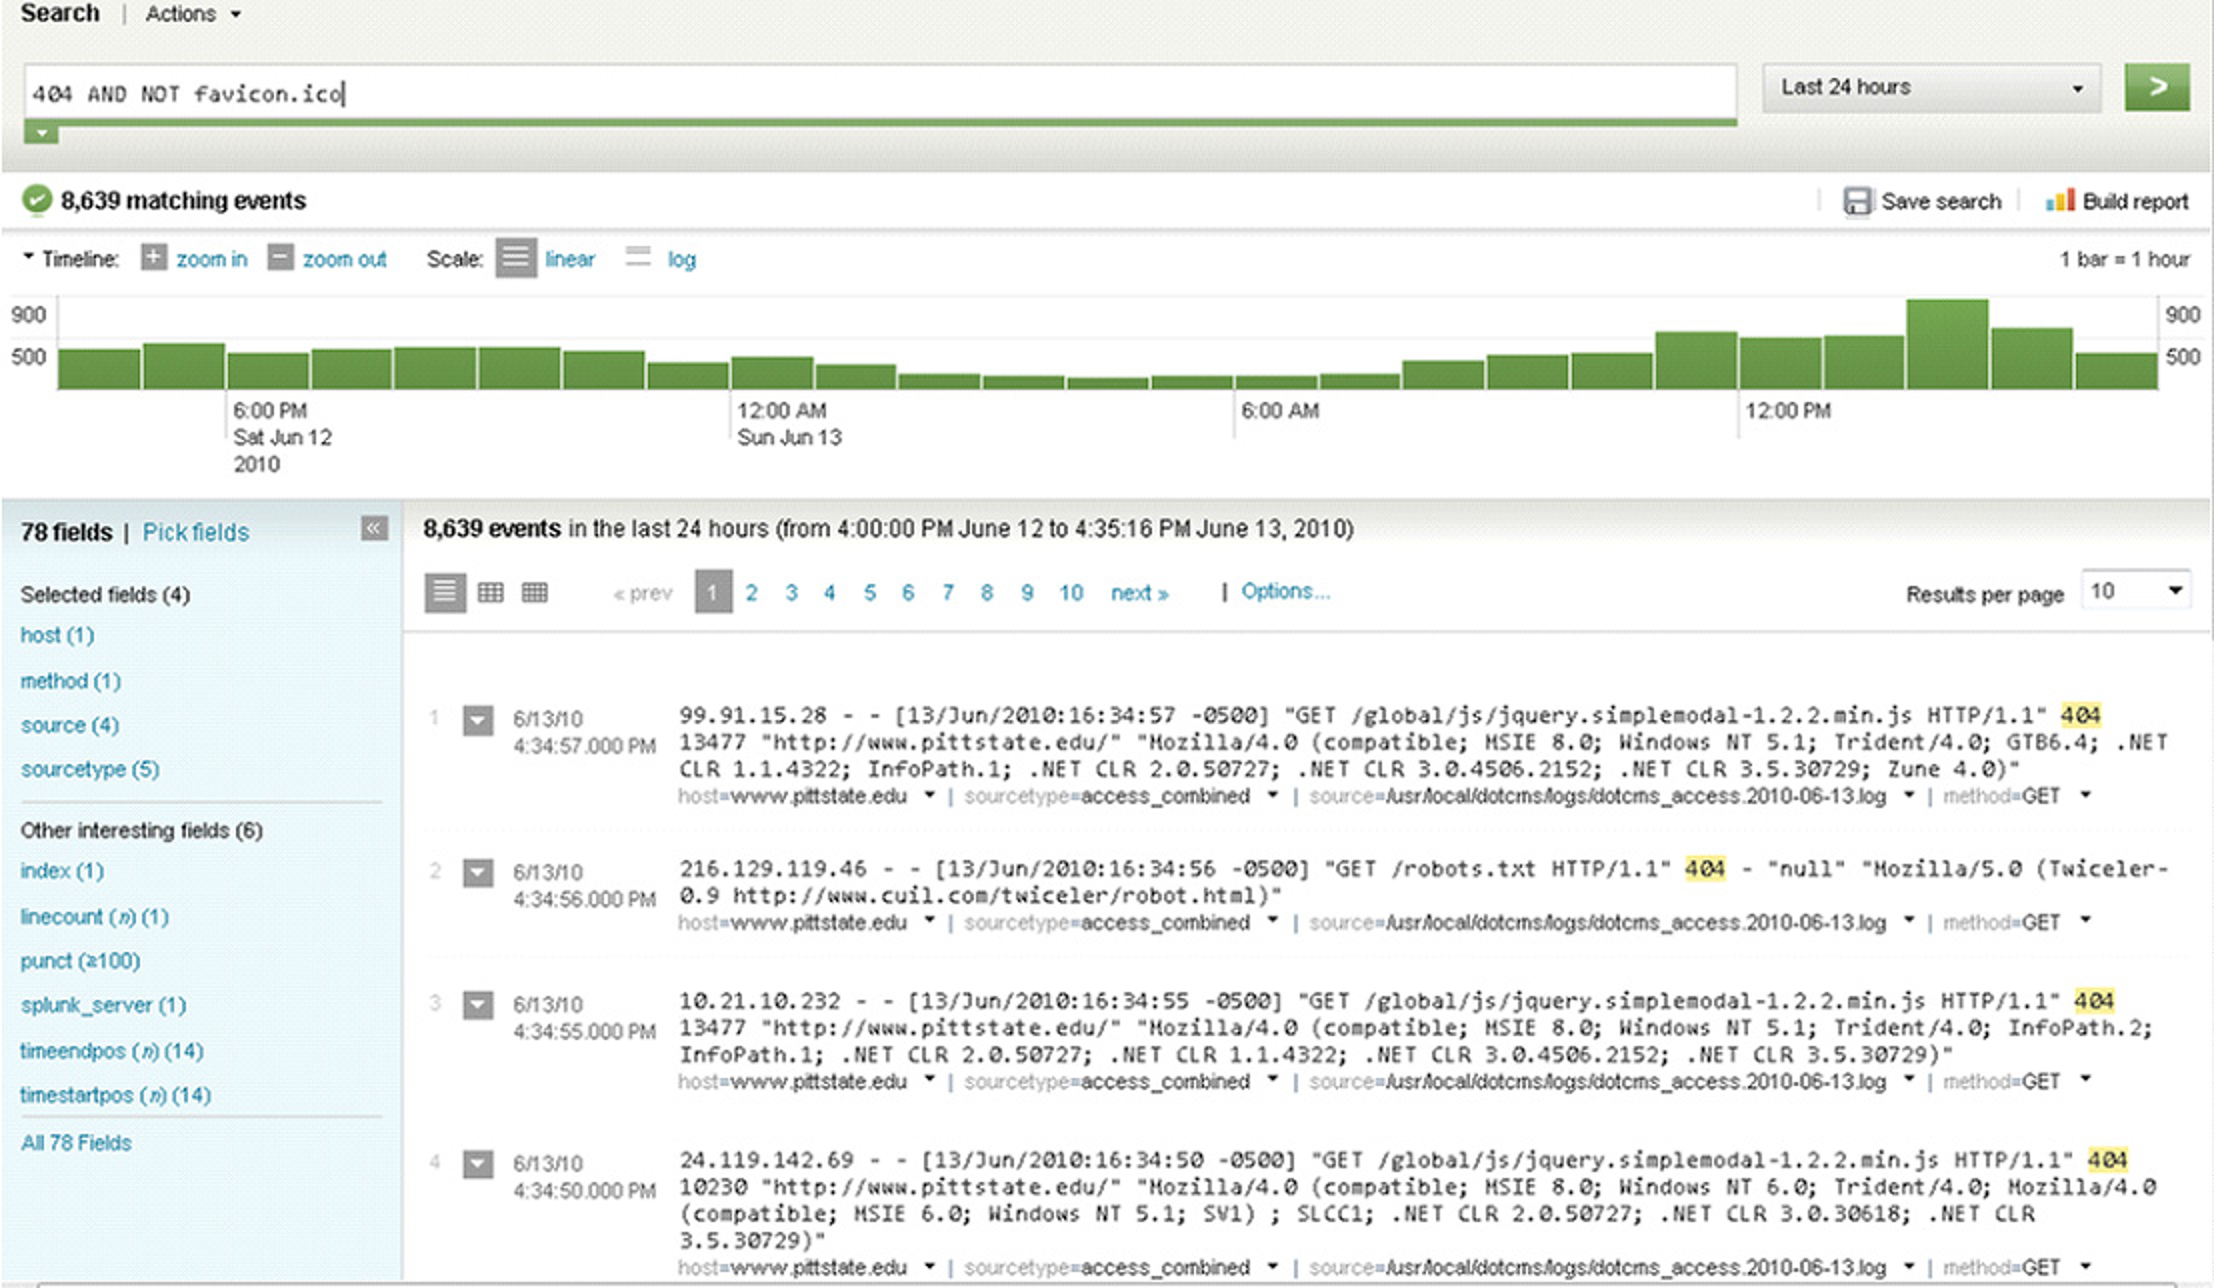
In this example we see the timeline which shows the number of events in the timeline. In this case one bar represents an hour. Below that you can see the actual events, or raw data. You can see the search query in the top as well showing that we wanted to see all the events with the text 404 in the last 24 hours excluding events with the text favicon.ico in it.
Here we can see the power of visualisation. If we were to use the traditional tools we could get some figures on the amount of 404 errors in our systems. But it would mean we would have to go through all the log files, probably miss a few, and then still we would only get the totals. With the graphs above in a matter of seconds we see much more. We see the hours when we have more of these errors. And we can zoom into them. In this case it tells us the amount seems to be in line with usage. We do expect to have less during the nights as user activity during the night is lower. If there would be a big spike at a certain time period that seems unrelated with extra usage we probably had an issue in the time-interval.
Effectively the information in the data is visualised. And this is very powerful. We see things we would not quickly identify otherwise. We get feedback from the system.
This is powerful. It helps with getting troubleshooting, identifying issues, root cause analysis. We can quickly prove or disprove ideas on what is going on and filter our red herrings. If we have an issue and see an error in the logs we may consider this the root cause. With operational intelligence systems we can see immediately how common or uncommon this particular error is.
The systems can however do much more. A powerful feature is to turn queries into dashboards. This can be very powerful on its own, but it can help us in testing.
In our complex systems usually you will find a common denominator. Often each message or log line belonging to a certain business process will contain a unique id that is used throughout the systems. It can be called many things, have a different name in different systems, but as long as the id is the same this can help us. We can quite easily get an overview of all the events in all our systems of the events belong to a certain id in chronological order. And that in turn means every event belonging to one particular test case! You may have tweak the search query a bit, but as soon as you have the right query it can be turned into a dashboard for all to use.
Experience
And that is exactly what we did. For a project involving business processes going over multiple systems we created a dashboard that would show all the events in all the systems belonging to a business process or rather a test case.
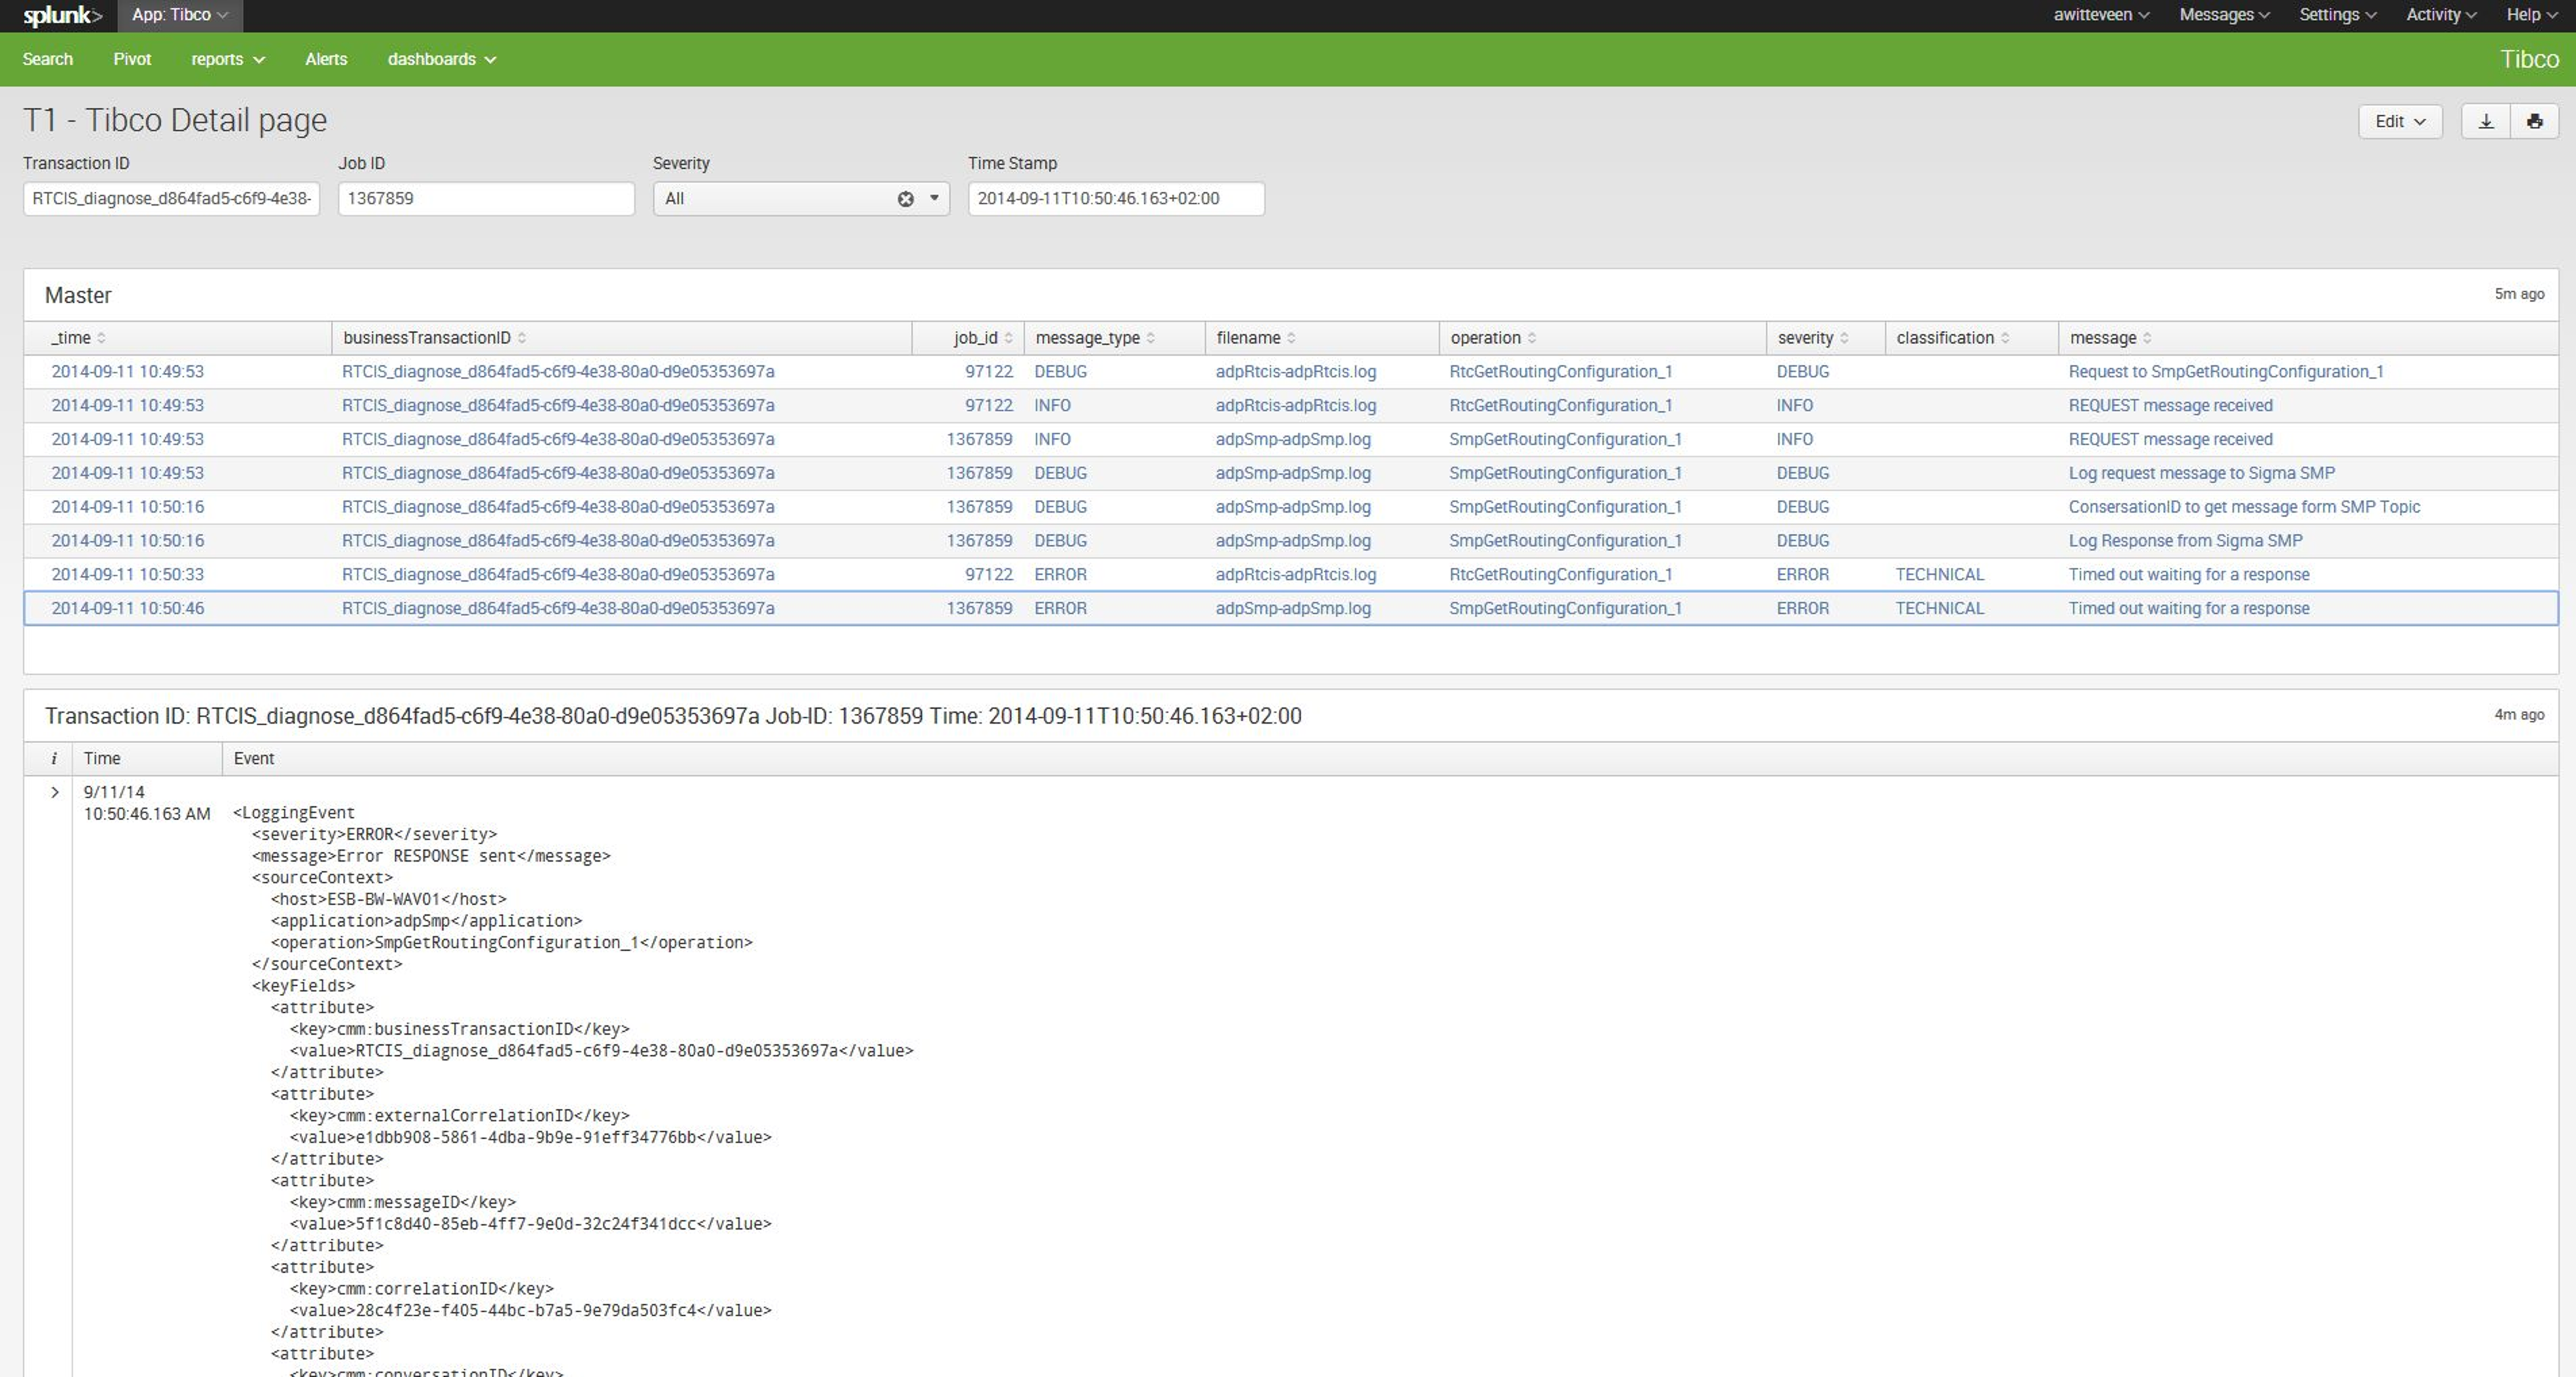
In this example in this dashboard you can simply enter the id of your business process. Finding that one is easy as well. In the system you search for something with your test data in it (i.e. customer name) click on an event found at the time of your test and simply copy paste right id. Use that id in this dashboard and you see all the events belonging to your test case.
You can even filter and show only the errors to quickly get to if there were indeed errors and what the root cause is. Rule of thumb, the first error (the oldest) is the root cause. Most errors afterwards are usually a result of the first error.
We had many more dashboards. The data easily translates into graphs, showing for instance the ratio of errors vs transactions over time. This gives the team a lot of feedback on the real reliability of the system.
Now back to the analogy DOS – Windows. Without operational analytics software you rely on learning the hard way to find all the information. The system doesn’t tell you where the information is. Finding details is hard work and it takes a lot of learning to accomplish this.
With the software, the testers get to see the information in one view. They see everything that matters, just like a settings window. They see all information related to their test case, not just the ones they were looking for. And so they learn very quickly how the business process really went without having to go through loads of documentation and even training.
With it they learned to test better, as they saw more information. They also were able to communicate with the solution teams much better. The insight in the full process and where something goes wrong means you can address the right team with the information that team understands. Much better than ‘I get an error’ and have shop around several solution teams until we finally discover which part of the system ultimately is doing something undesired.
Just like the shift that started with Windows 95, they became able to work and understand the full flow without needing extensive training, experience and hard work.
Caveats
Setting up an operational intelligence system is not just a matter of installing a bit of software. You need people to understand how and where systems store their information and make this available into the operational intelligence system. More than that, it usually also takes someone with proper knowledge of the systems to set up some dashboards.
These systems also don’t replace other software. Often when you ask new software in a larger company people often ask what it can replace. It is not test automation software. It doesn’t test for you. It helps you analyse and does this on steroids, but it cannot fit into the ‘test automation’ category.
Properly set up, properly supported it can be be a great addition that helps you test better, and helps complex projects get through difficult integration phases.
Get started
The more complex your system, the more beneficial it can be. But that doesn’t mean it needs to be complex. I remember when we were asked to solve an issue with a backup that was plaguing a Windows server for some time. This was an isolated server, not too complex. We loaded the event viewers log file into our software (Splunk in this example). Within seconds we noticed a huge increase of error messages of a network adapter that came at the precise date the backup issues started. Seeing the spike visually, and seeing what all those messages told us gave is the answer in minutes. Just one log file…
So you can get started easily. There is commercial software available that you can use for free if you don’t require too much data to be analysed or don’t need advanced features. There is also open source software available that is however harder to set up, doesn’t have all the features and will require more system resources.