Do you struggle to speed up your web performance analysis?
Mais Tawfik Ashkar of (PerfNG,) presented the award winning Tutorial at the 2018 EuroSTAR Software Testing Conference on this very subject and also hosted a webinar here on Huddle which you can watch back HERE.
Do you want more free webinars like this? Join Huddle as a member a receive unlimited FREE learning resources.
These are some of the top questions asked during the webinar and may help you in your performance testing.
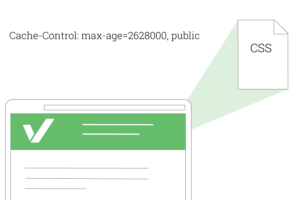
1. What is the difference between cache control public and catch control private?
It really depends on the application that you are using. If I am hitting Wikepedia.org and I am calling certain static assets, that static asset is not only going to be cached on my browser but any intermediary proxy server that could serve it later from a cache perspective, once someone else is hitting that page. When it is private, it is only being cached within a local copy of my browser.
2. How is TruClient protocol of LoadRunner different from the tools mentioned in this webinar?
The TruClient protocol of LoadRunner allows you to get an understanding of the end user response time. There is often limitations with how many loads you can run with those and the server capacity of the load engines that are supporting that. They just server it in a different level, not to say that that doesn’t offer much value, it does, but this is to provide value before you can begin scripting.
![]()
3. What are the APM options for Front end code, e.g. Salesforce application. I have identified that a page has problems with front end code. How do I know which Javascript code is causing the performance issue?
Once you look at the traffic are you able at least which of the requests that are happening or taking the longest? If you know it is in the Javascript, is there a Javascript file that is taking longer is taking longer to come back, sometimes it is the processing in the script. This is really a different kind of tutorial if we wanted to dive into but the tools themselves provide your way to look at the elements and the code within the page and see where most of the time is being spent so it takes more interaction within the web page test tool itself. In this webinar, we are really focusing on the traffic that is happening at the HTTP layer where you could dive further among the other features within the deck tools in Chrome. Basically, the answer to this would take a lot longer than we have time for.
Mais will be speaking at the 2019 EuroSTAR Conference in Prague. Her half day Tutorial ‘Holistic Performance Testing: Change, Chaos, Conformity & Conflict’ will take place on Tuesday 12th November .